The Major Warning Signs
Like Krakatau, Mount Pinatubo in the Philippines in 1991 rumbled and belched gases and expelled clouds of ash for days, often explosively. In fact, the first news of trouble came from a local nun, who told volcanologists that a vent was spewing toxic gas. The scientists set up monitoring equipment and then retreated to nearby Clark Air Force Base to study the incoming data.
By early June 1991, the activity had escalated, including several large blasts. Were these explosions a coda—a punctuated ending to this event? Or, as with Krakatau, were they a prelude to a bigger blast? The scientists forecast the latter—and urged locals to leave the area. Their forecast was a probability and not a certainty and spanned over several days. They had issued warnings in the days before, and nothing major happened. But this time, on June 15, 1991, they were right. The second most powerful volcanic eruption of the 20th century killed hundreds rather than hundreds of thousands of people, thanks to the advance notice.
What kind of data do scientists collect and interpret? Not all of it is scientific. A nun working in the region around Mount Pinatubo saw a “steam cloud” (actually sulfurous gas) after hearing an explosion. Local volcanologists took her seriously and rushed up the mountain right away to observe and measure the scene and set up monitoring equipment. Later scientists from the United States Geological Survey joined the effort and set up more equipment.
|
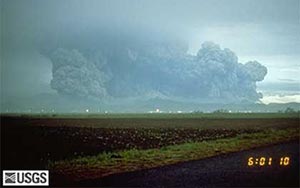
The Philippines Islands’ Mount Pinatubo began rumbling to life in 1991. After weeks of predicted eruptions, in the early morning of June 15, the volcano blasted clouds of gas and ash into the air, as seen in this photo. This eruption was one of the biggest of the 20th century. |
|
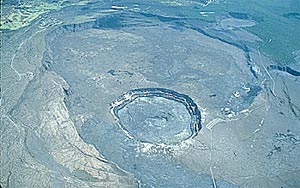
Scientists monitoring the caldera at the summit of Hawaii’s Kilauea note the changes in deformation. This has allowed them to note a cycle of eruptions. |
|
The rate of emissions and the contents of the plume of smoke can help indicate the strength of an eruption. |
In October 2002 in Italy, fishermen smelled a sulfur odor, spotted dead fish floating on the sea, and watched jets of water suddenly spout up. Nearby Mount Etna soon erupted.
Scientists also consider the history of a volcano, which is written in the slopes. Layers of old lava flows and pyroclastic material indicate how often and how explosively a volcano can erupt—and where the blast is likely to do the most damage.
The key scientific data include:
Deformation—changes in the surface rocks and water. Rising magma and swollen magma chambers push the ground up, raising the elevation of the rocks and changing the angle of their slope. Lasers and simple instruments called tiltmeters and strain meters help scientists measure these changes. Rocks are brittle and so scientists also look for cracks and cave-ins created by pressure from magma. Other ground observations are an increase or a decrease in the level of a crater lake and changes in the mineral contents and temperature of groundwater.
Deformation is a major predictor of Hawaii’s frequent Kilauea eruptions. Data have shown a gradual rise in the summit elevation and then a collapse at the time of eruption. With the seismic data, scientists have mapped a monthly cycle of eruptions that have allowed them to forecast the next event days and sometimes weeks ahead of time.
Gases—types and rate of emission. Gases rise through vents called fumaroles (from the Latin for “smoke”) and other cracks. Sometimes the concentrations are high enough to create acid rain that kills vegetation—the trees at the Long Valley, California, caldera, for example. That’s one very visible sign of activity, but scientists have several ways to measure the rate of emissions more precisely. They can collect samples from vents directly, as Williams’s team did at Galeras, but it is safer to use remote sensing instruments. Scientists dangle infrared and correlation spectrometers from airplanes, for example, and fly through a plume of gas. These instruments read energy signatures—thermal output or electromagnetic frequencies—to identify and quantify the gases.
|
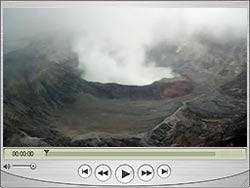
Steam rises from the crater lake of Poás volcano in Costa Rica. |
For example, before the Mount St. Helens eruption of 1980, the level of carbon dioxide (CO2) rose from 90,719 kg (100 tons) per day to 907,185 kg (1,000 tons) per day. In a volcano, the heavier sulfur dioxide (SO2) emerges after the CO2. This gas can be good news, since it means that the magma has lost much of its lighter gas gradually rather than explosively. Less gas means a less forceful eruption—or perhaps none at all.
Seismic activity—from tremors to swarms of tremors. No volcano can wake up and stir without shaking the ground. Volcanoes and earthquakes go hand in hand. The challenge is to determine which patterns of seismic waves precede an eruption. A surge of magma into a chamber cracks the neighboring rocks and creates short-period seismic waves. As the magma begins to rise and leave the chamber, the seismic waves near the summit shift to long-period waves. A continuous movement of magma results in harmonic seismic waves.
|
The pattern of seismic activity—earthquakes—on a volcano can indicate when an eruption may occur. |
In general, volcanologists get excited when the long-period and harmonic patterns dominate near the summit, the frequency of tremors turns into a swarm, or an unusual pattern appears. At Galeras, an earthquake pattern called tornillos precedes four out of five eruptions. The word means “screws” in Spanish and describes the unique shape of their seismograph recording.
The more evidence scientists can collect, the more complete their picture is of what’s happening inside a volcano. They’ve even found value in listening to a volcano’s song.
This content has been re-published with permission from SEED. Copyright © 2026 Schlumberger Excellence in Education Development (SEED), Inc.


